
Table of Contents
Analyzing the business
In e-commerce, data helps you answer key questions about your business.
- Why are sales down this week? You check page views and see traffic has dropped, maybe it’s time to review your ad campaigns or SEO.
- Why is a popular product not selling? You notice it gets plenty of views but no conversions, which could point to pricing, photos, or missing information.
- Which channels are actually driving revenue? You compare sales data across sources and see that email converts better than paid ads—so you double down on what’s working.
Every question leads to analysis, and every analysis leads to smarter decisions.
A typical e-commerce journey with data analysis usually follows a predictable path—starting simple and gradually moving toward advanced solutions as needs grow.
Here’s how this progression usually unfolds, and why each stage eventually leads to the next:
1. You Start with Built-In Platform Dashboards
When you launch your online store, everything you need is right in front of you. Shopify shows your sales and orders. Google Ads tells you how your campaigns are doing. Meta Ads gives you clicks and conversions.
You’re running lean, and these native dashboards do the job. No setup, no cost, and real-time numbers.
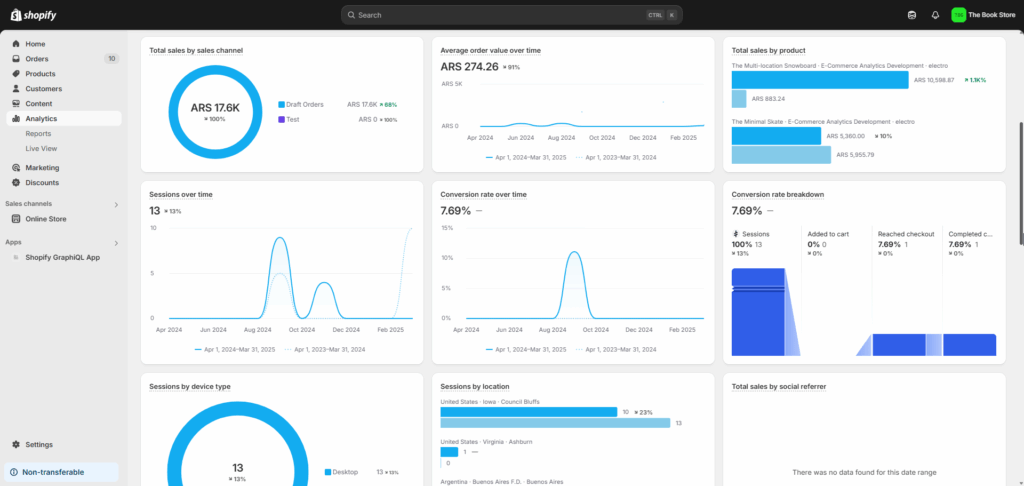
🔴But soon, you hit a wall. Shopify can’t tell you how much you spent to acquire those sales. Google Ads can’t show you which products people actually bought. You’re jumping between tabs, copying numbers, trying to figure out if you’re profitable.
2. You Subscribe to an All-in-One SaaS Dashboard
To save time and stress, you sign up for a tool like Triple Whale, Lifetimely, or Polar Analytics. These tools connect to everything—Shopify, Google Ads, Meta, Klaviyo—and show you one clean dashboard.
Now you finally see CAC, ROAS, LTV. You feel in control again.
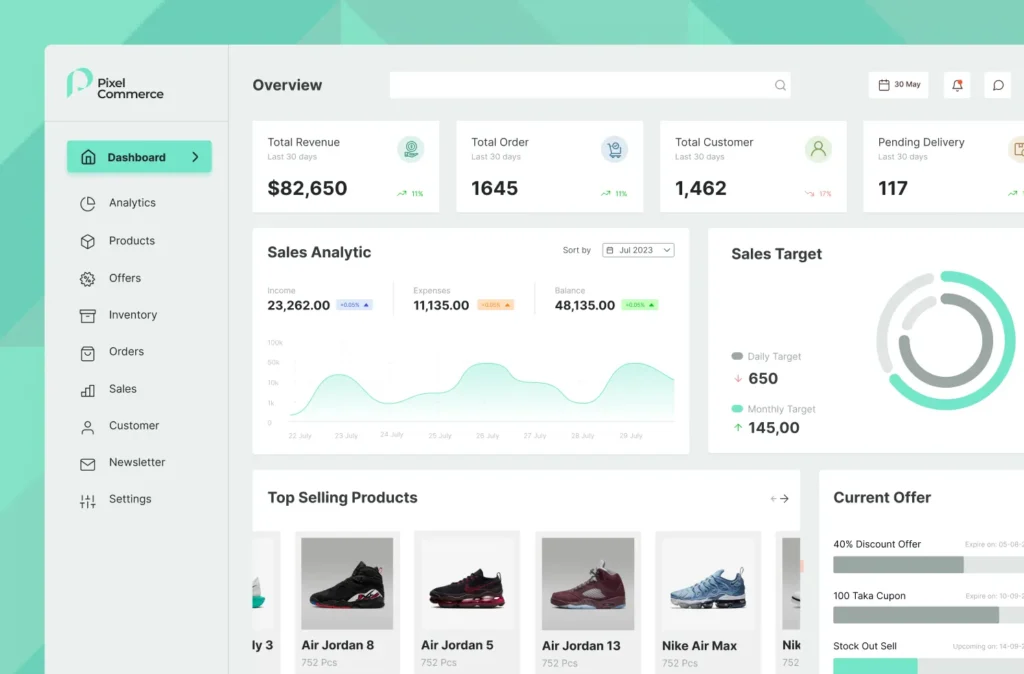
🔴But then reality kicks in. You want to see returns by product. Or match ad spend to product margins. Maybe you run influencer campaigns manually and want to track their performance. The SaaS tool doesn’t support your custom processes. The numbers start feeling off.
3. You Export to Spreadsheets
You go back to basics. You download CSVs from Shopify and Google Ads. You clean them up in Google Sheets. You build a custom report that finally makes sense for your business. You even automate the exports using tools like Google Apps Script, Supermetrics, or Zapier.
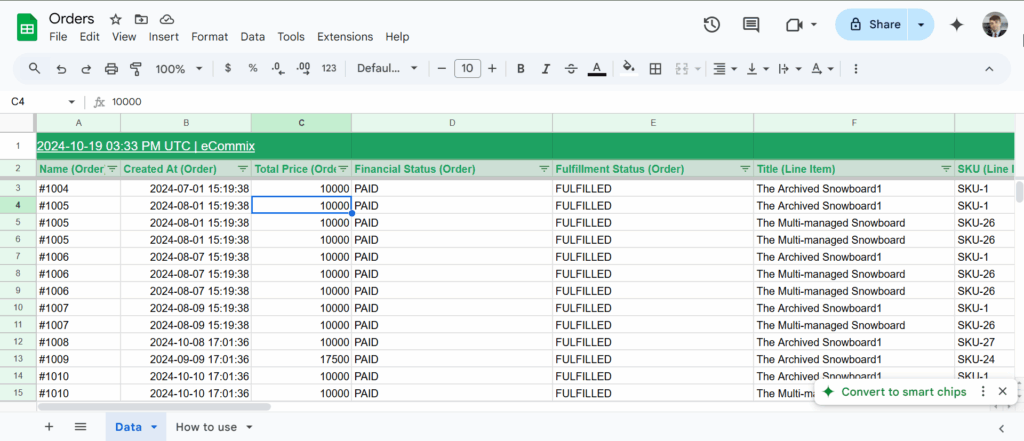
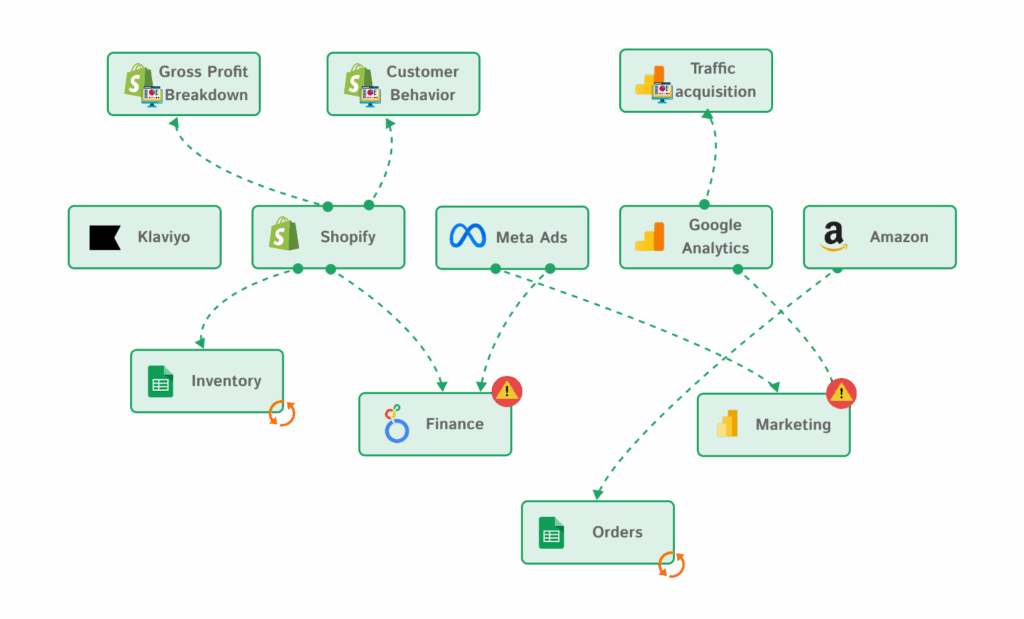
🔴But it’s a mess. You spend more time updating spreadsheets than growing your store. Column names change. Someone deletes a row. You can’t trace where errors come from. You’re duct-taping a reporting system.
4. You Move to a BI Tool
You finally set up Looker Studio or Power BI. Now you can visualize your data properly. You centralize your sources, create nice dashboards, and share them with your team.
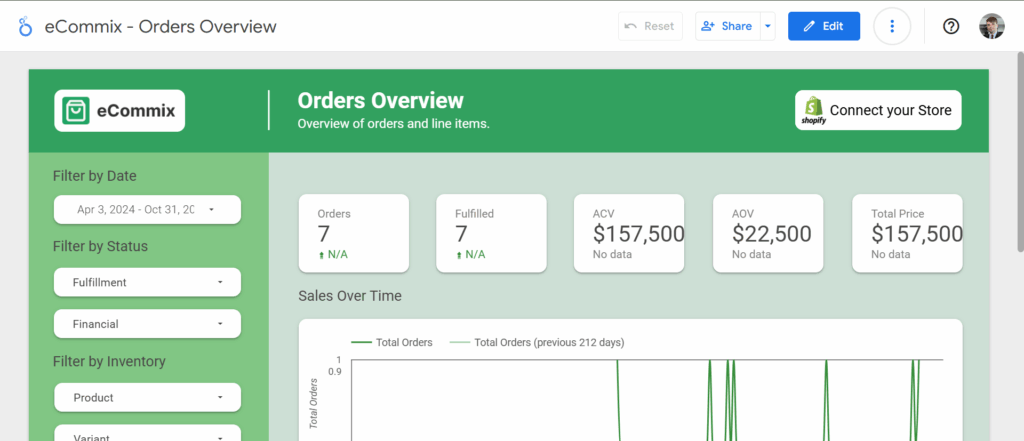
🔴But again—you hit a ceiling. Joining data is hard. You want to analyze cohorts, create custom metrics, or track profitability over time. But Looker Studio is slow, fragile, and doesn’t handle large datasets well. You need more power and structure.
If you spend more time fixing your reports than actually using them, it’s time to rethink your analytics setup.
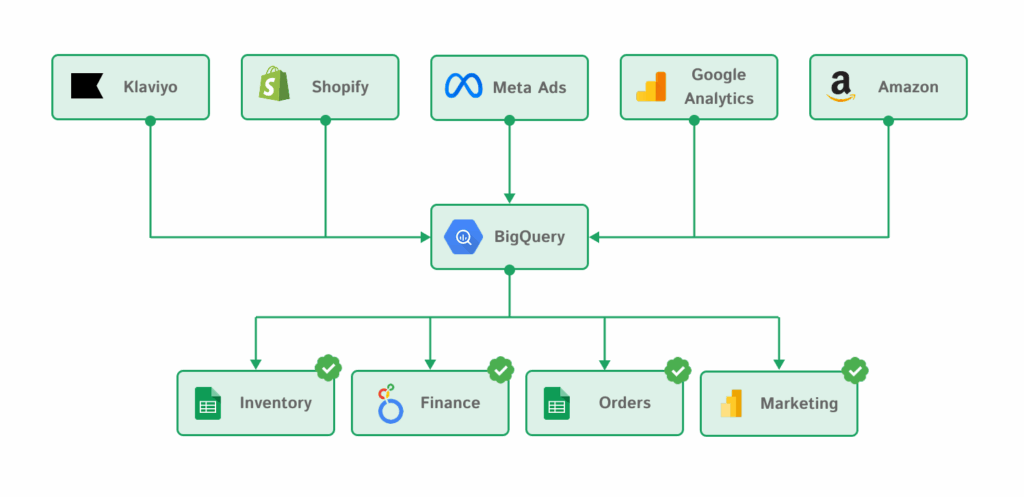
5. You need your own analytics infrastructure
As your business grows, so do your questions—and built-in dashboards or SaaS tools won’t always have the answers. To make confident, data-driven decisions at every stage, you need your own analytics infrastructure.
- 🟢 Complete data. Unify data from every platform—Shopify, Google Ads, Meta, Klaviyo, and even spreadsheets—so you’re not missing key parts of the picture. By integrating the raw data, you gain full control and flexibility to define metrics exactly how your business needs them—no black-box calculations, no limitations.
- 🟢 Accurate Data. Trust the numbers. Your metrics are calculated exactly the way your business needs, without hidden logic or platform-specific quirks.
- 🟢 Historic data. Go beyond what native dashboards show. Store raw, day-by-day data for as long as you want to analyze trends, seasonality, and long-term growth.
- 🟢 Consistent Metrics. Standardize definitions across all sources. No more wondering why “sales” in Google Analytics doesn’t match Shopify or Meta.
- 🟢 Scalable Setup. Your stack grows with you—from 100 to 100,000 orders. No performance issues or limits on data volume.
- 🟢 Flexible Modeling. Create custom metrics, segment data how you want, and adjust logic as your business changes—without waiting on third-party tool updates.
- 🟢 Real-Time or Near Real-Time. Keep your dashboards fresh with up-to-date data so you can act fast—whether it’s adjusting ad spend or spotting a sudden dip in sales.
- 🟢 Cost-effective. Build an infrastructure that fits your budget. By building on cloud tools like BigQuery with usage-based pricing, and open-source or no-code transformation tools, you can scale without overspending—and avoid the high monthly fees of SaaS tools that don’t fully meet your needs.
Introducing the Modern Data Stack
In this series, we’re going to run an experiment to show why you, as a business owner, need a custom analytics infrastructure. We’ll simulate a real-world scenario using common platforms most stores rely on:
- Shopify
- Google Ads
- Google Analytics
- Odoo
- Google Sheets
We’ll keep it simple, the beauty of a custom infrastructure is that it can scale with the complexity of your operations, unlike built-in tools that often limit flexibility.
We’ll explore how a strong data foundation becomes the backbone for answering any question about your business. Along the way, we’ll also look at different tools, their alternatives, and the advantages and disadvantages of each.
The core question we’ll aim to answer is: Is my business profitable?
And we want to be able to answer that question at any point in time, without manual work.
We’re going to follow the three stages that make up a modern analytics infrastructure:
- 1. Extract / Load: Use tools that pull data from your e-commerce, marketing, and operational platforms and load it into a centralized location.
- 2. Transform: Clean, model, and standardize your data to create a semantic layer and unified metrics. Structure everything within a cloud-based data warehouse to serve as a single source of truth—modular, scalable, and ready for fast querying.
- 3. Present: Deliver tailored dashboards and reports with visual insights for different teams—marketing, operations, finance, and beyond.