

2 min read
Build a Real-Time Shopify Orders Board in Google Sheets with Webhooks
Stream key order events to a Google Sheets board so operations can act faster on paid and fulfilled status changes.
Read more →Bulk edit products, sync inventory, export reports, and automate workflows — without touching the Shopify admin.
Free plan available · No credit card required
Build a simple inventory planner in Google Sheets and know exactly what to reorder and when.
Bulk edit prices, tags, and product data using formulas — no manual work.
Create custom dashboards for profit, sales, and performance — beyond Shopify's limits.
Edit titles, tags, status, and images in one place and sync instantly.
Schedule syncs and keep your reports always up to date without lifting a finger.
Give suppliers, fulfillers, and vendors access to only their products — no Shopify logins needed.
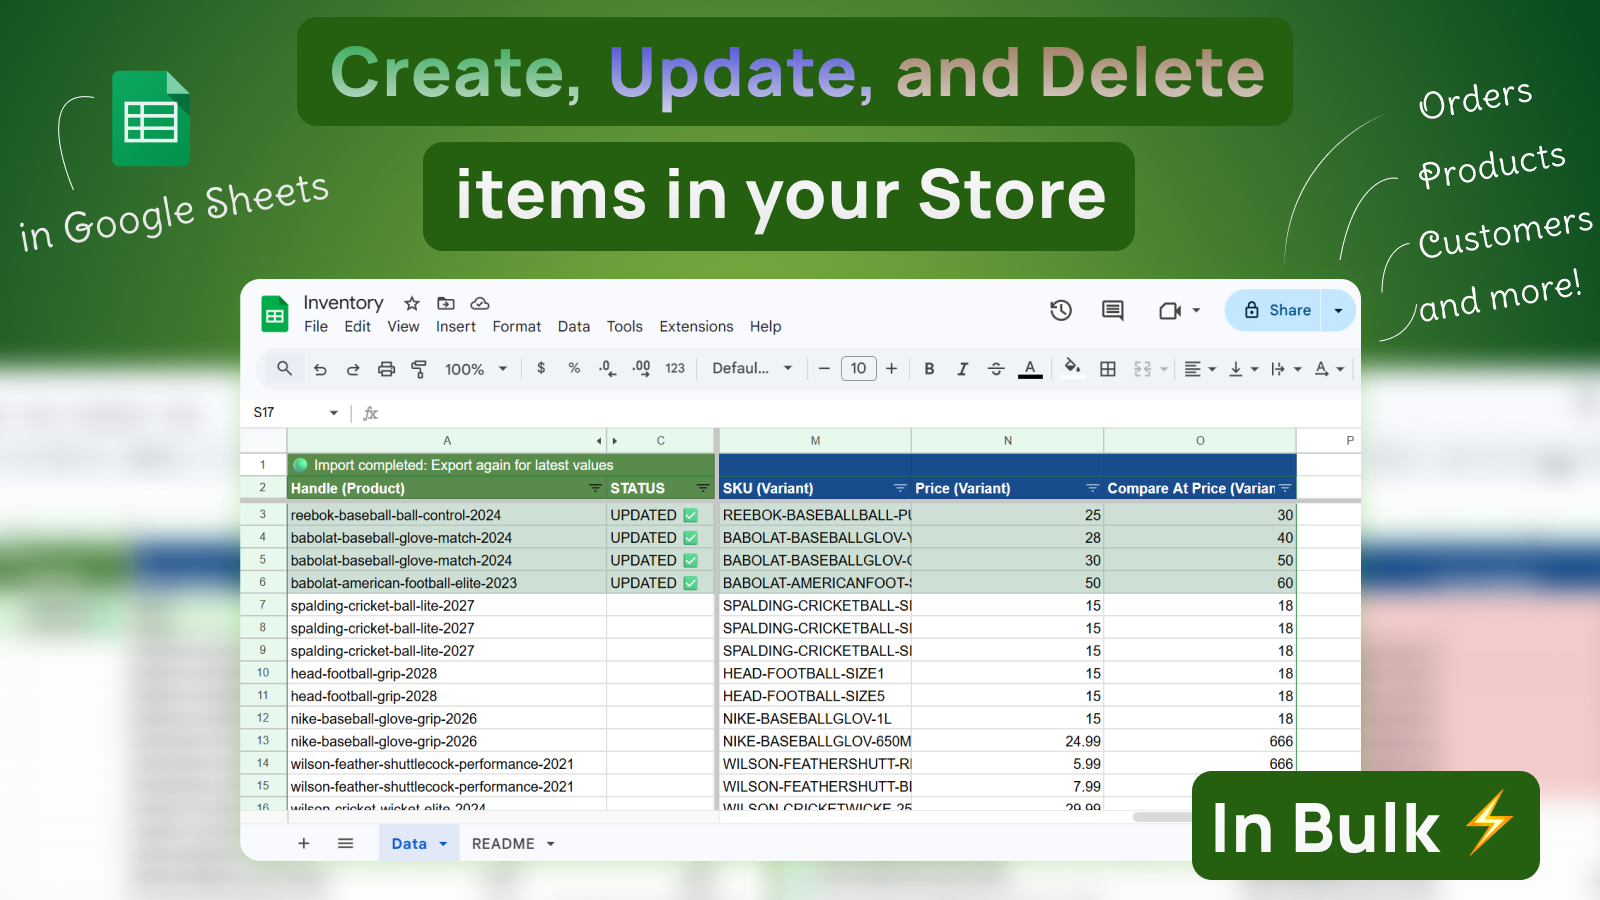
Export any combination of Shopify fields to Google Sheets, edit with formulas or paste-in data, then import back with a single click. No CSV files, no developer help.
Sync in 2 min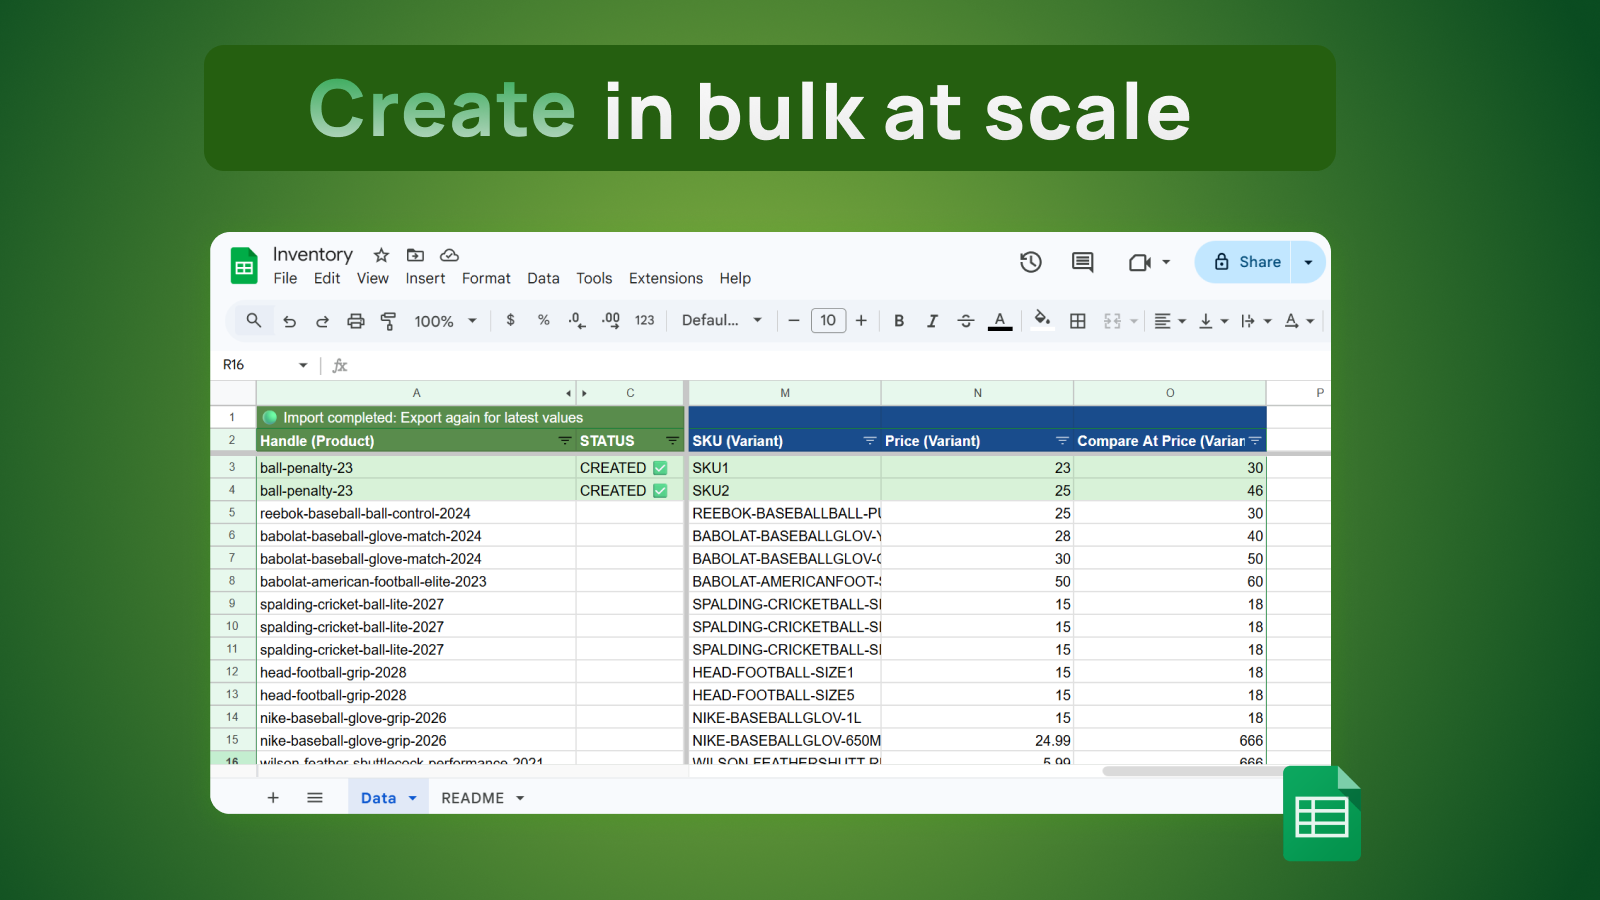
Orders, inventory, customers, metafields — schedule recurring exports or pull on demand. Use Sheets formulas, pivot tables, and charts to analyse your data.
Sync in 2 min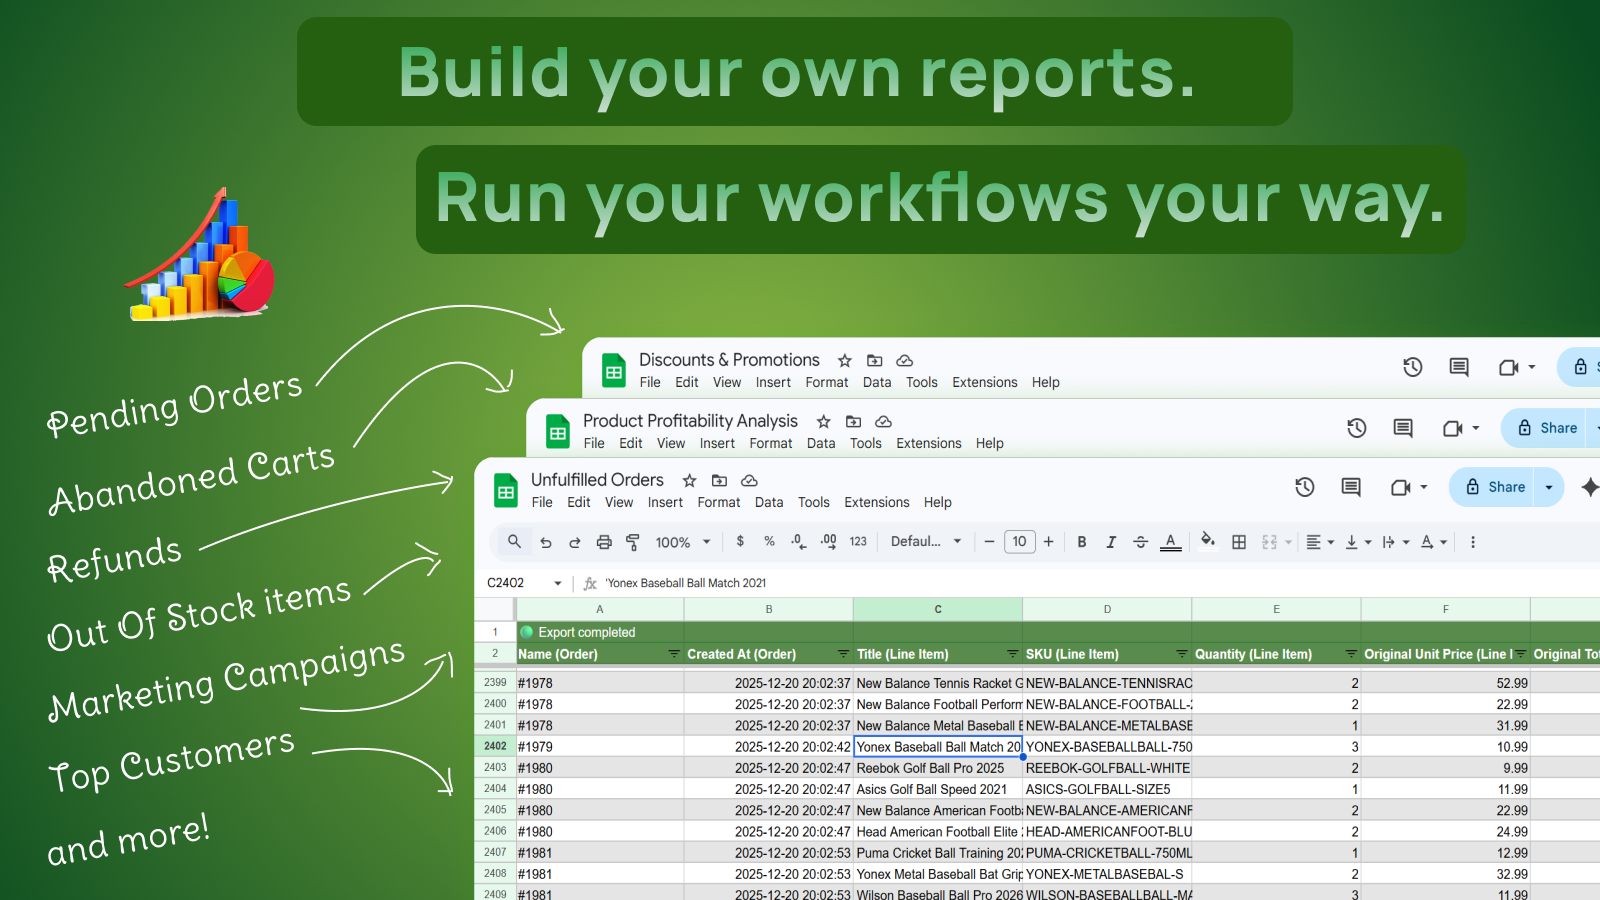
Refresh data hourly, daily, weekly, or trigger updates instantly from Shopify events. Keep reports and operational sheets current without manual exports.
Sync in 2 min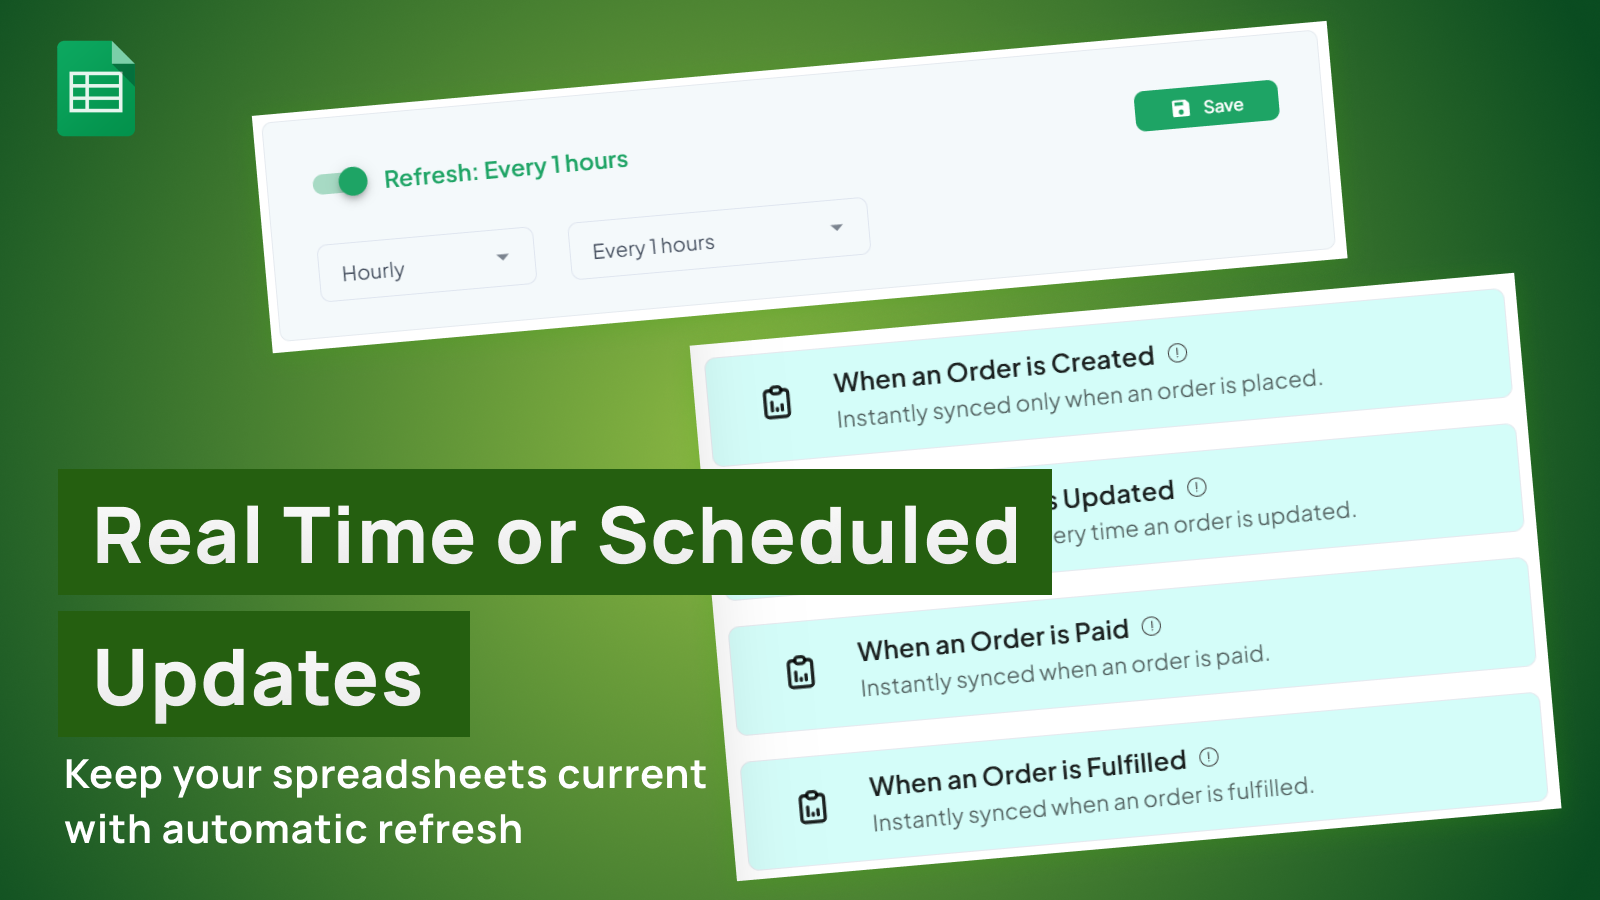
Extract custom sales and operational data by writing ShopifyQL queries directly in eCommix. Build tailored spreadsheets for the exact metrics and dimensions your team needs.
Sync in 2 min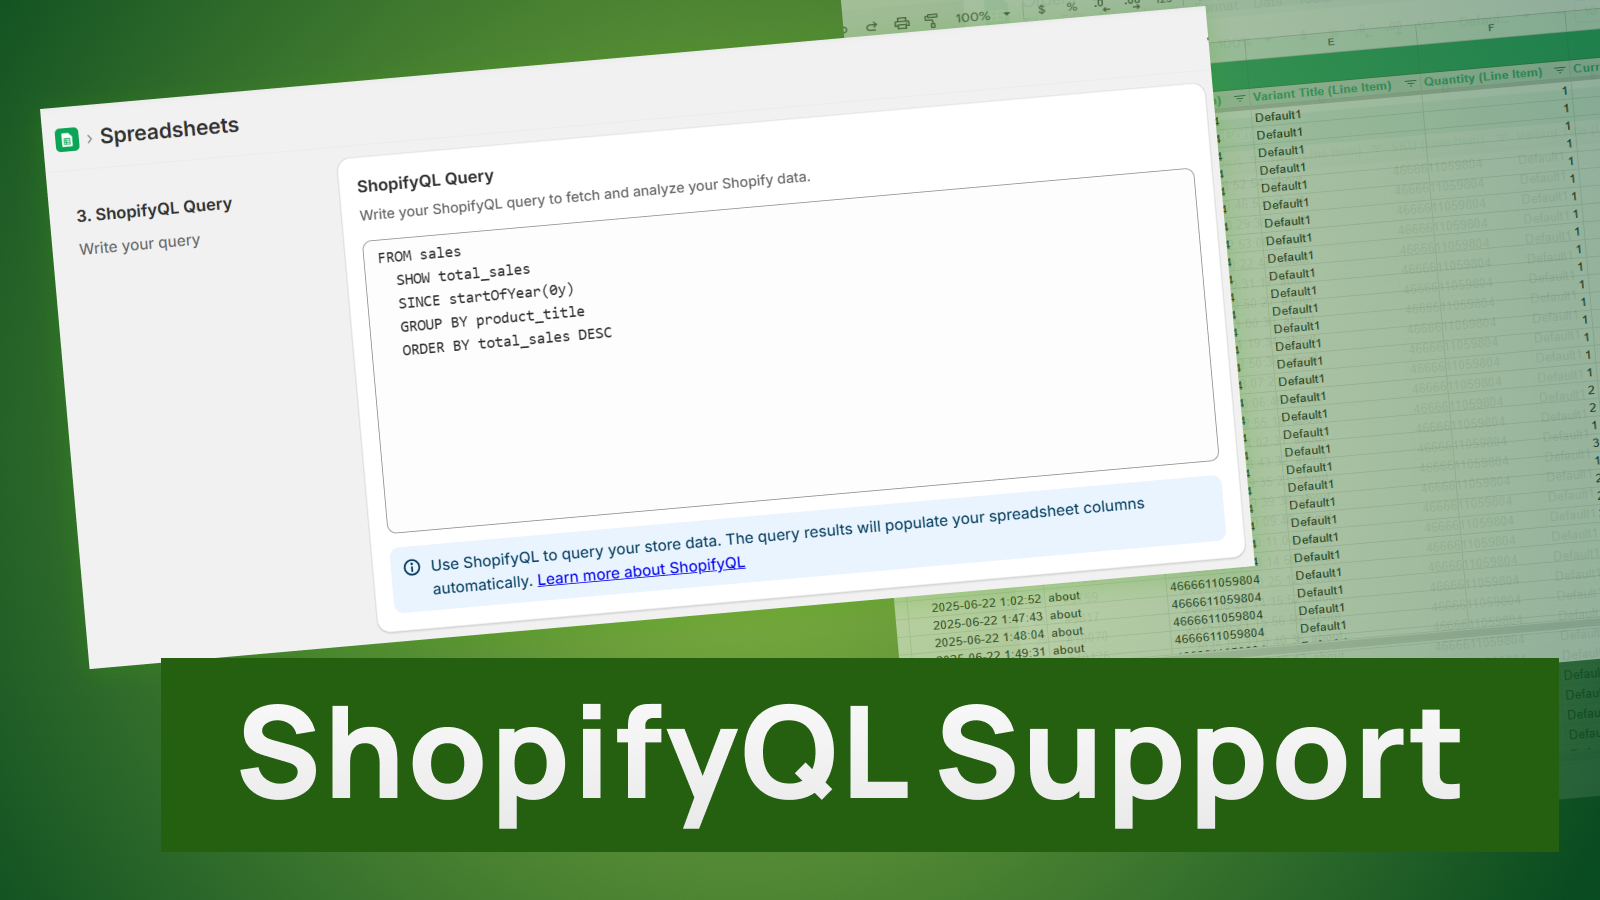
"What a great app! I can't do proper planning without it. I sync data to Google Sheets, use Python to massage the data and add a couple of rules to spit out what we need to order upfront. Great app, thanks a million!"
No code. No CSV wrangling. No re-learning your workflow.
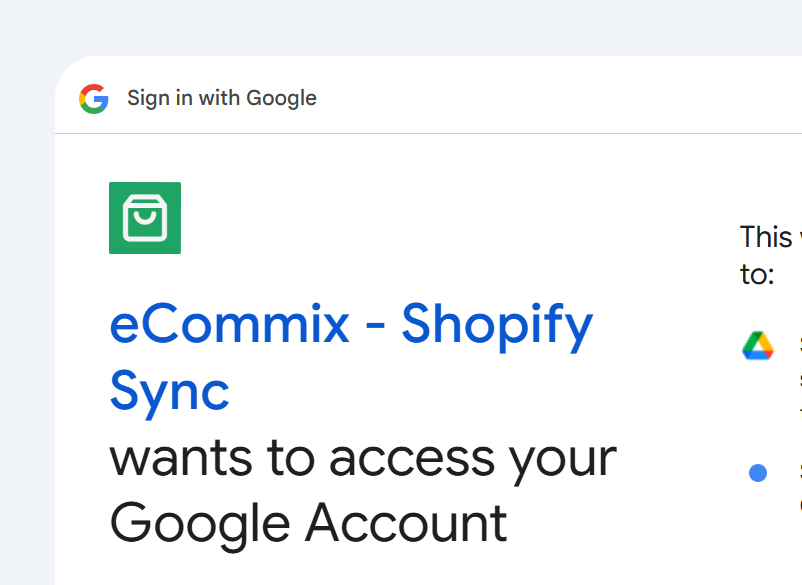
Sign in with Google and grant access so eCommix can create and sync spreadsheets in your account.
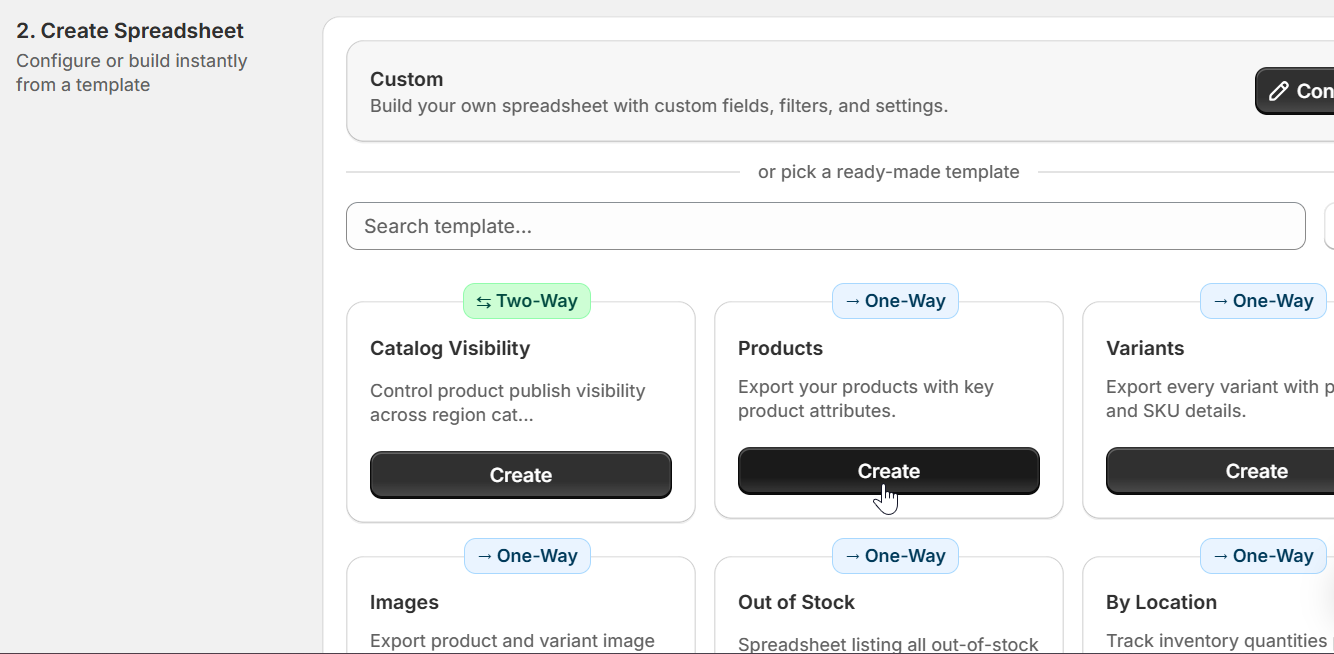
Pick what you want to work with — Products, Inventory, Orders, Customers — and export to a Google Sheet.
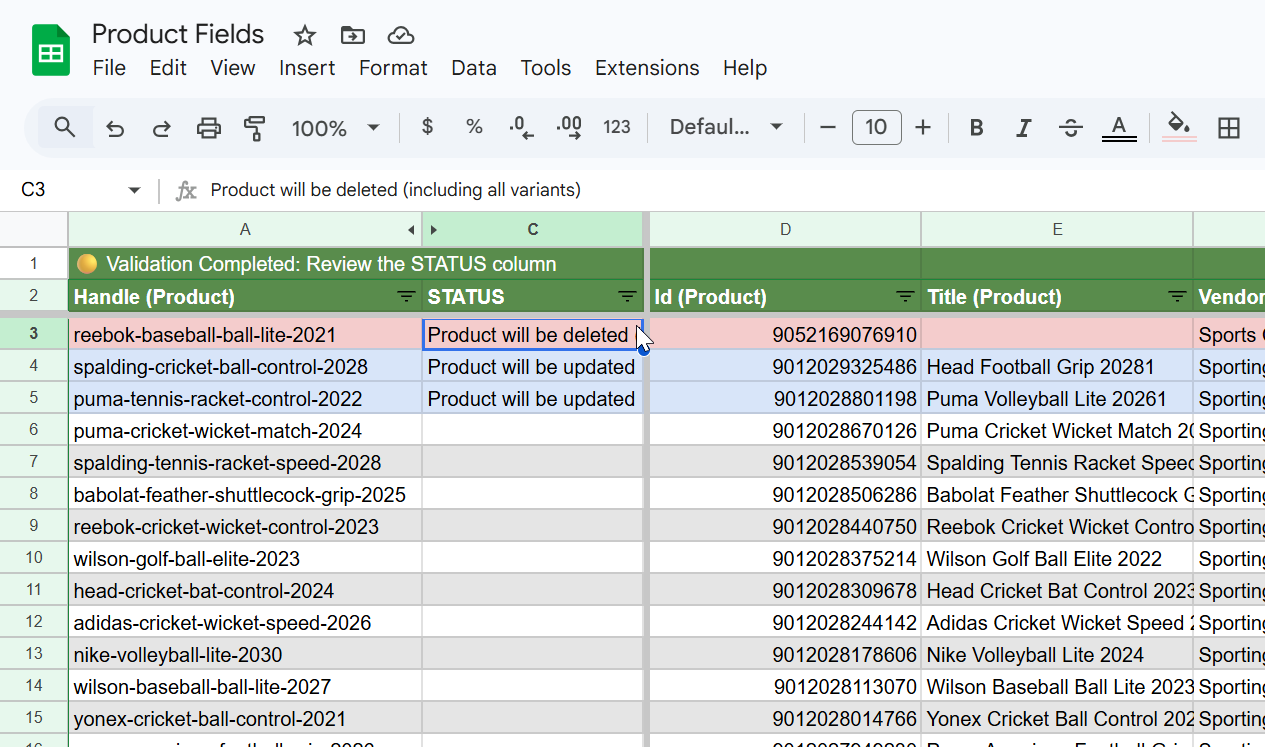
Make changes in the spreadsheet and import back. Validate the diff, then confirm. Done.
Learn
Stream key order events to a Google Sheets board so operations can act faster on paid and fulfilled status changes.
Read more →Manage Shopify product collections in bulk by editing the Collections (Product) column in Google Sheets with eCommix - Google Sheets Sync.
Read more →Update Shopify product tags in bulk using Google Sheets and eCommix - Google Sheets Sync. Add, remove, or replace tags faster with a spreadsheet workflow.
Read more →Standardize and fix Shopify variant barcodes in bulk using a spreadsheet workflow for cleaner operations.
Read more →Update Shopify variant prices and compare-at prices in bulk using Google Sheets and eCommix - Google Sheets Sync.
Read more →Update Shopify product SEO titles and meta descriptions in bulk using Google Sheets and eCommix - Google Sheets Sync.
Read more →Reference
How to evaluate Shopify bulk edit apps for large catalogs, with practical criteria for speed, safety, and repeatable operations.
Read more →Create a practical Shopify data quality pipeline in Google Sheets to catch catalog issues before they reach storefront and campaigns.
Read more →Compare first-touch and last-touch UTM signals per order to improve campaign budget decisions.
Read more →Compare eCommix - Google Sheets Sync and Matrixify for Shopify bulk operations, automation, validation, and spreadsheet-based workflows.
Read more →Detailed comparison of eCommix - Google Sheets Sync and Mixtable for Shopify spreadsheet operations, automation, and team collaboration.
Read more →Build a profit-by-SKU report in Google Sheets by combining Shopify sales and cost data for margin-focused decisions.
Read more →Stories
Operational runbook for using AI agents in Shopify spreadsheet workflows without sacrificing control and data quality.
Read more →Reusable prompt templates for AI agents supporting Shopify merchandising, inventory operations, and SEO spreadsheet workflows.
Read more →Reduce import mistakes by using color and status signals in Sheets to spot new, changed, and delete-intent rows.
Read more →Agency teams can scale Shopify operations with repeatable spreadsheet workflows for imports, exports, and client reporting.
Read more →Free plan available. No credit card. Works with any Shopify store.
Sync in 2 minJoin thousands of Shopify merchants already using eCommix